03 · Embedded systems · Deployed product
Sparks Gateway
A live, revenue-relevant metering system: it reads commercial three-phase meters, signs every record, and anchors the resulting log so a tenant's bill can be independently checked rather than merely believed.
Commercial sub-metering and billing transparency for multi-tenant venues

The problem
In multi-tenant commercial venues, electricity is usually recharged to tenants by a utility management company. The tenant sees a number on an invoice and has essentially no way to audit how it was derived — which meter, which tariff block, which demand charge, which loss allocation.
The system
Sparks Gateway sits between the meters and the billing conversation. Eastron SDM630 three-phase meters are polled over Modbus RTU by a Raspberry Pi 5 gateway with LTE backhaul, so the installation does not depend on a venue's network.
Every reading is written into a tamper-evident log: records are signed with Ed25519 keys held on the gateway, and batches are Merkle-anchored on Base. The result is that a historical reading cannot be quietly revised after the fact — if the log is altered, the anchor no longer verifies.
The tariff analysis
Metering only settles the question if the tariff maths is also correct. I did a detailed reconstruction of the applicable tariff structure against measured consumption for a real billing dispute against a utility management company, and the analysis surfaced an overcharge of roughly 52%.
That result is the strongest artefact of this project: it is engineering work that changed a commercial outcome, not a demonstration.
What it demanded
Industrial serial protocols and field wiring, reliable long-running firmware and services on constrained hardware, remote fleet operation over LTE, applied cryptography for integrity rather than secrecy, and enough regulatory and tariff literacy to make the numbers defensible.
Reconciliation reporting
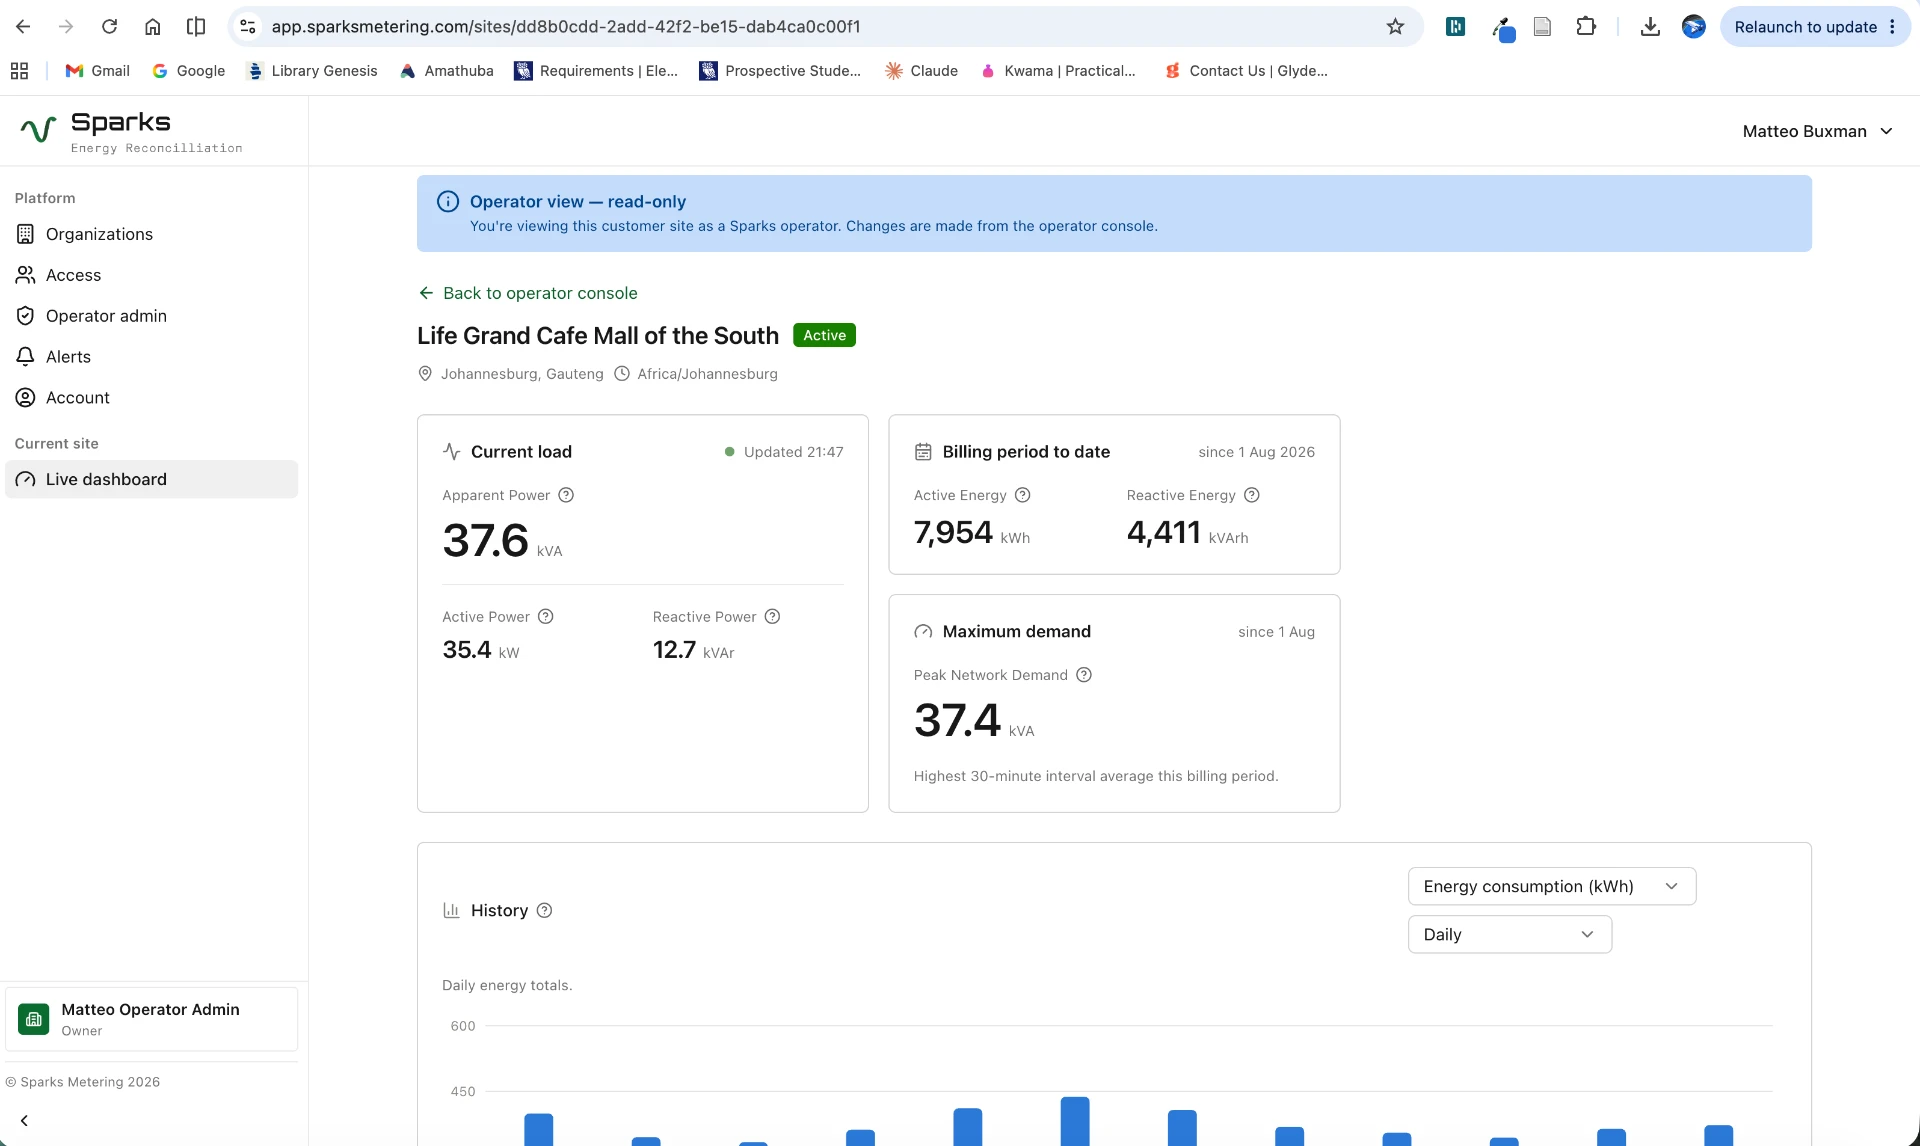
Beyond raw metering, the platform generates detailed reconciliation reports that map measured consumption against invoiced charges, tariff blocks and demand periods. The dashboard below shows live load, billing-period totals and maximum demand for a deployed site, giving operators and tenants a single, auditable view of where the numbers come from.